The Pimcore Dashboard
The Pimcore Dashboard welcomes Pimcore users after logging in to the Admin Panel. With the help of portlets, the user quickly gains an overview of the changes in the Pimcore system. Out of the box, they can see how many and which objects, assets or documents have been changed. With the integration of Google Analytics in Pimcore, page views and sessions can also be displayed graphically.
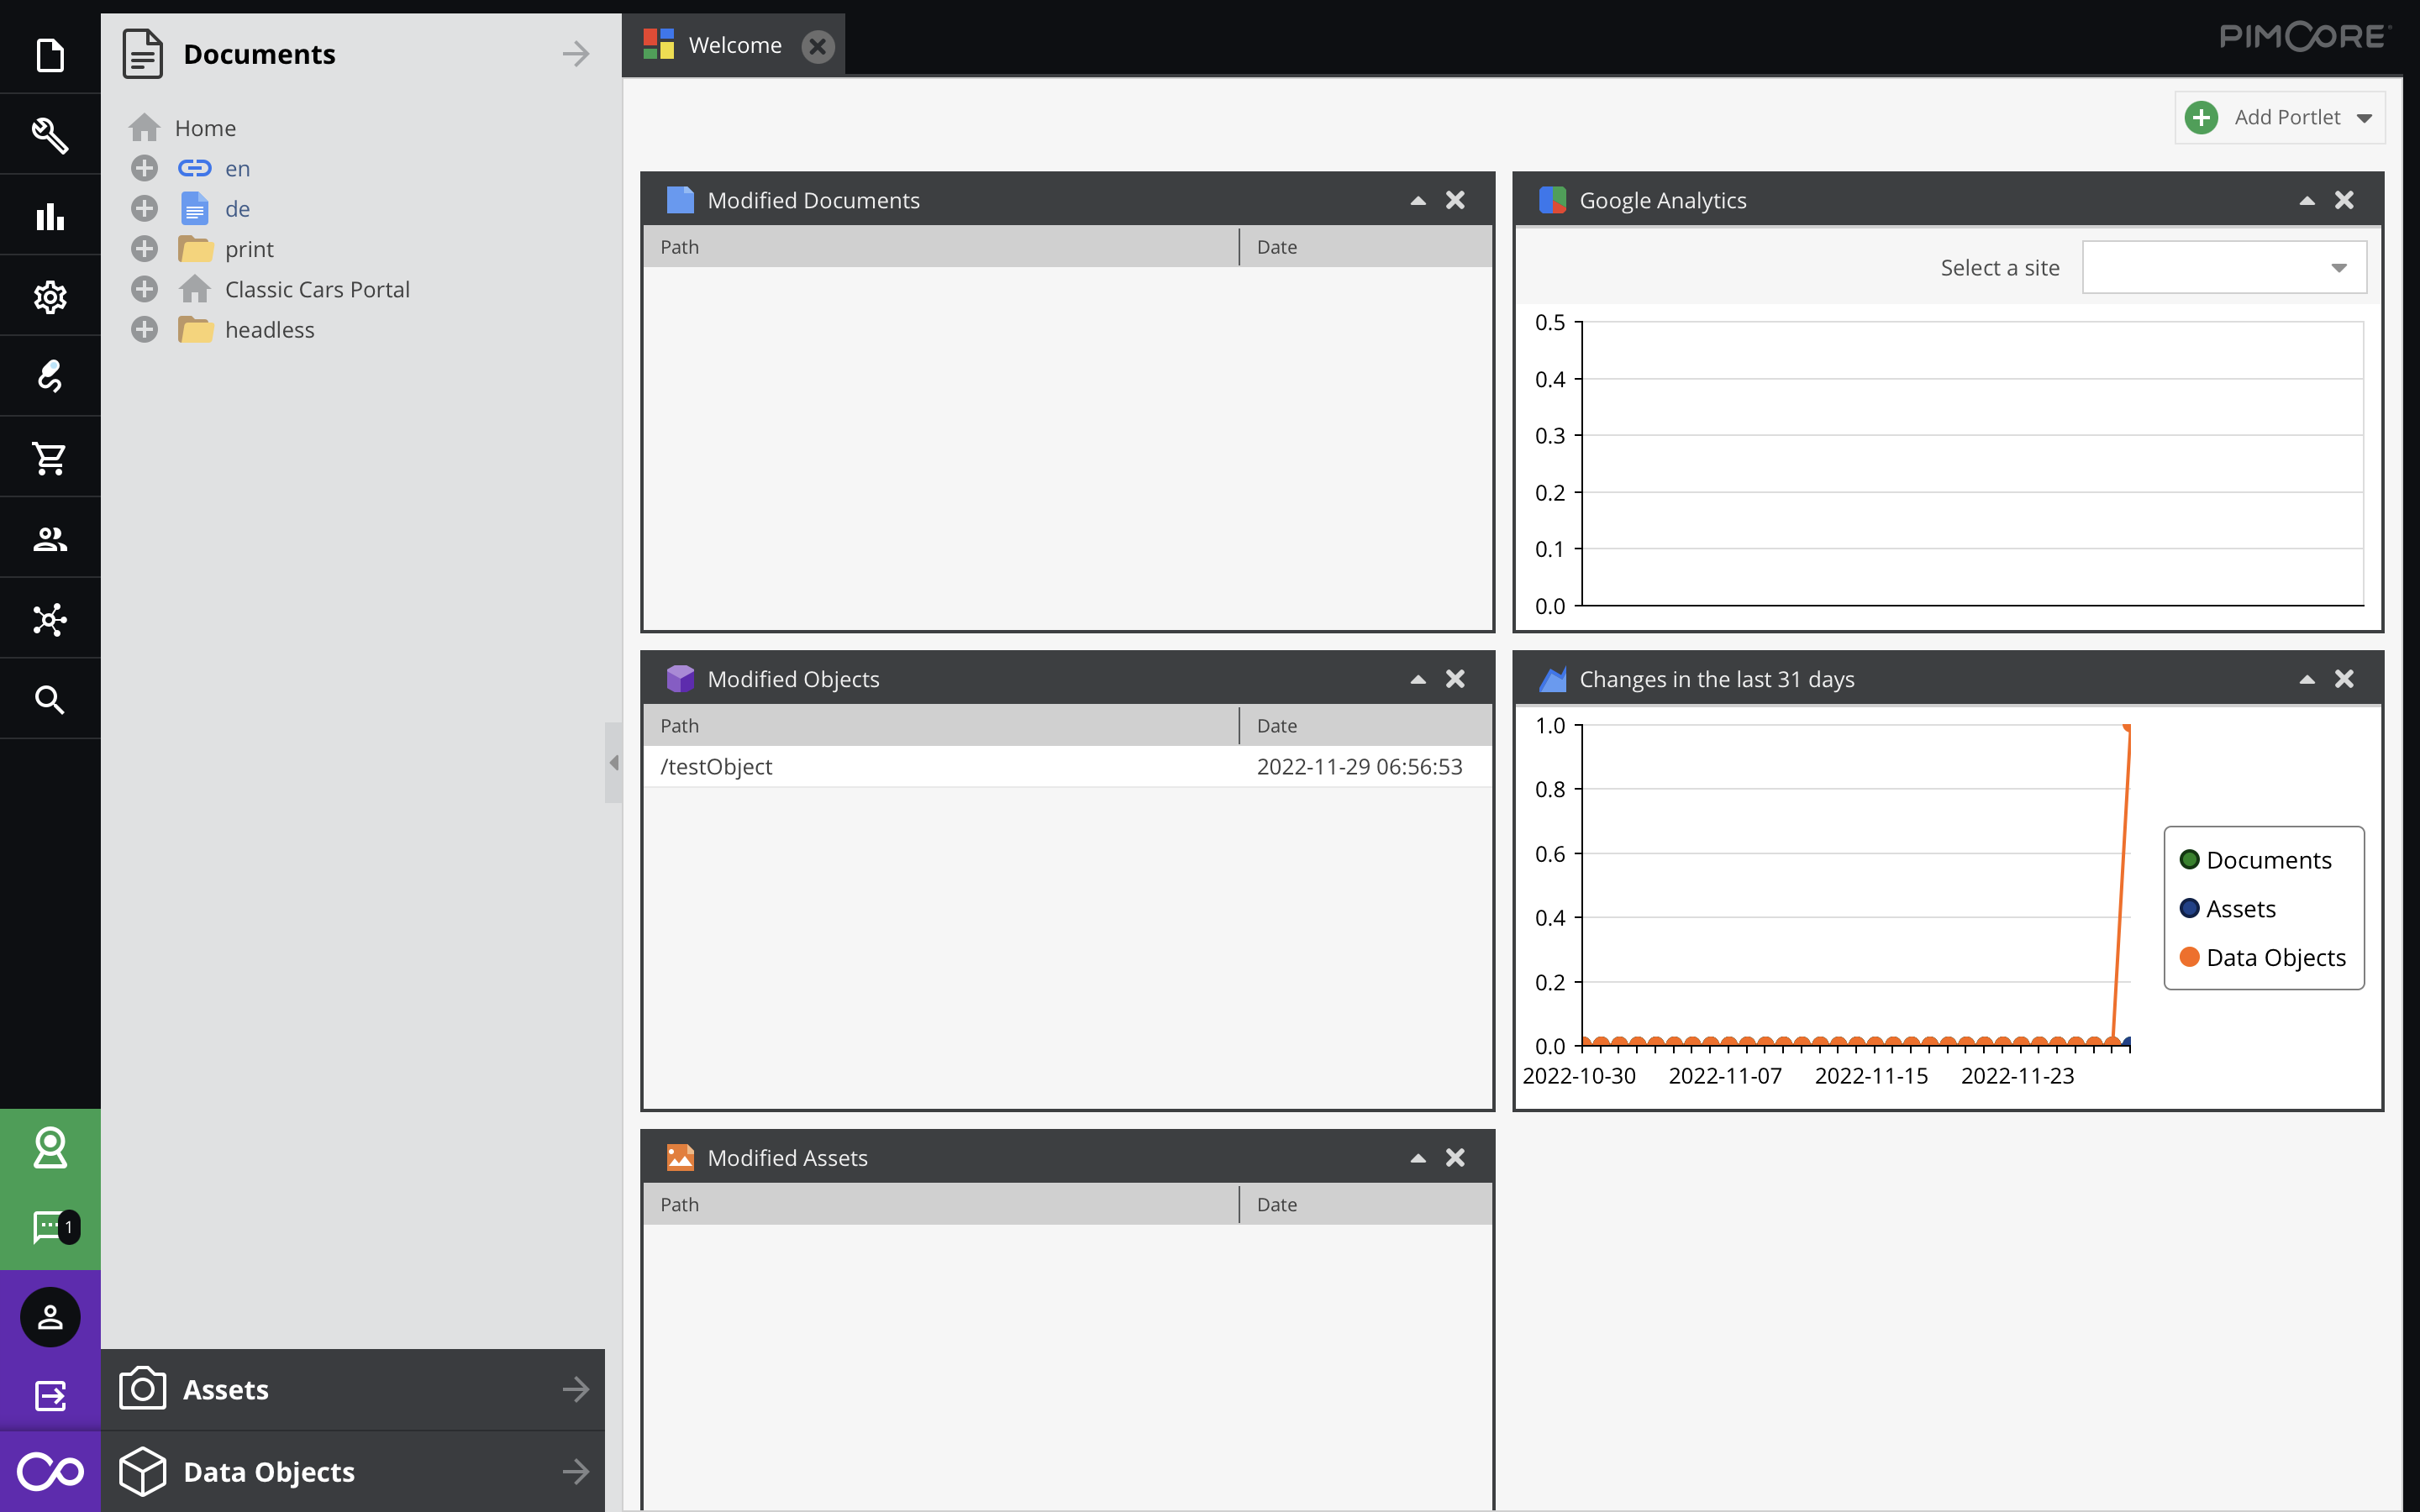
However, these portlets, which are included in the scope of every installation, should be seen more as examples. They are intended to encourage users to develop their own portlets in order to provide them with quick entry points into the administration of the assets stored in Pimcore. In this way, customised reports (e.g. all products without price) can be configured and displayed in a portlet.
External web content on the Pimcore dashboard
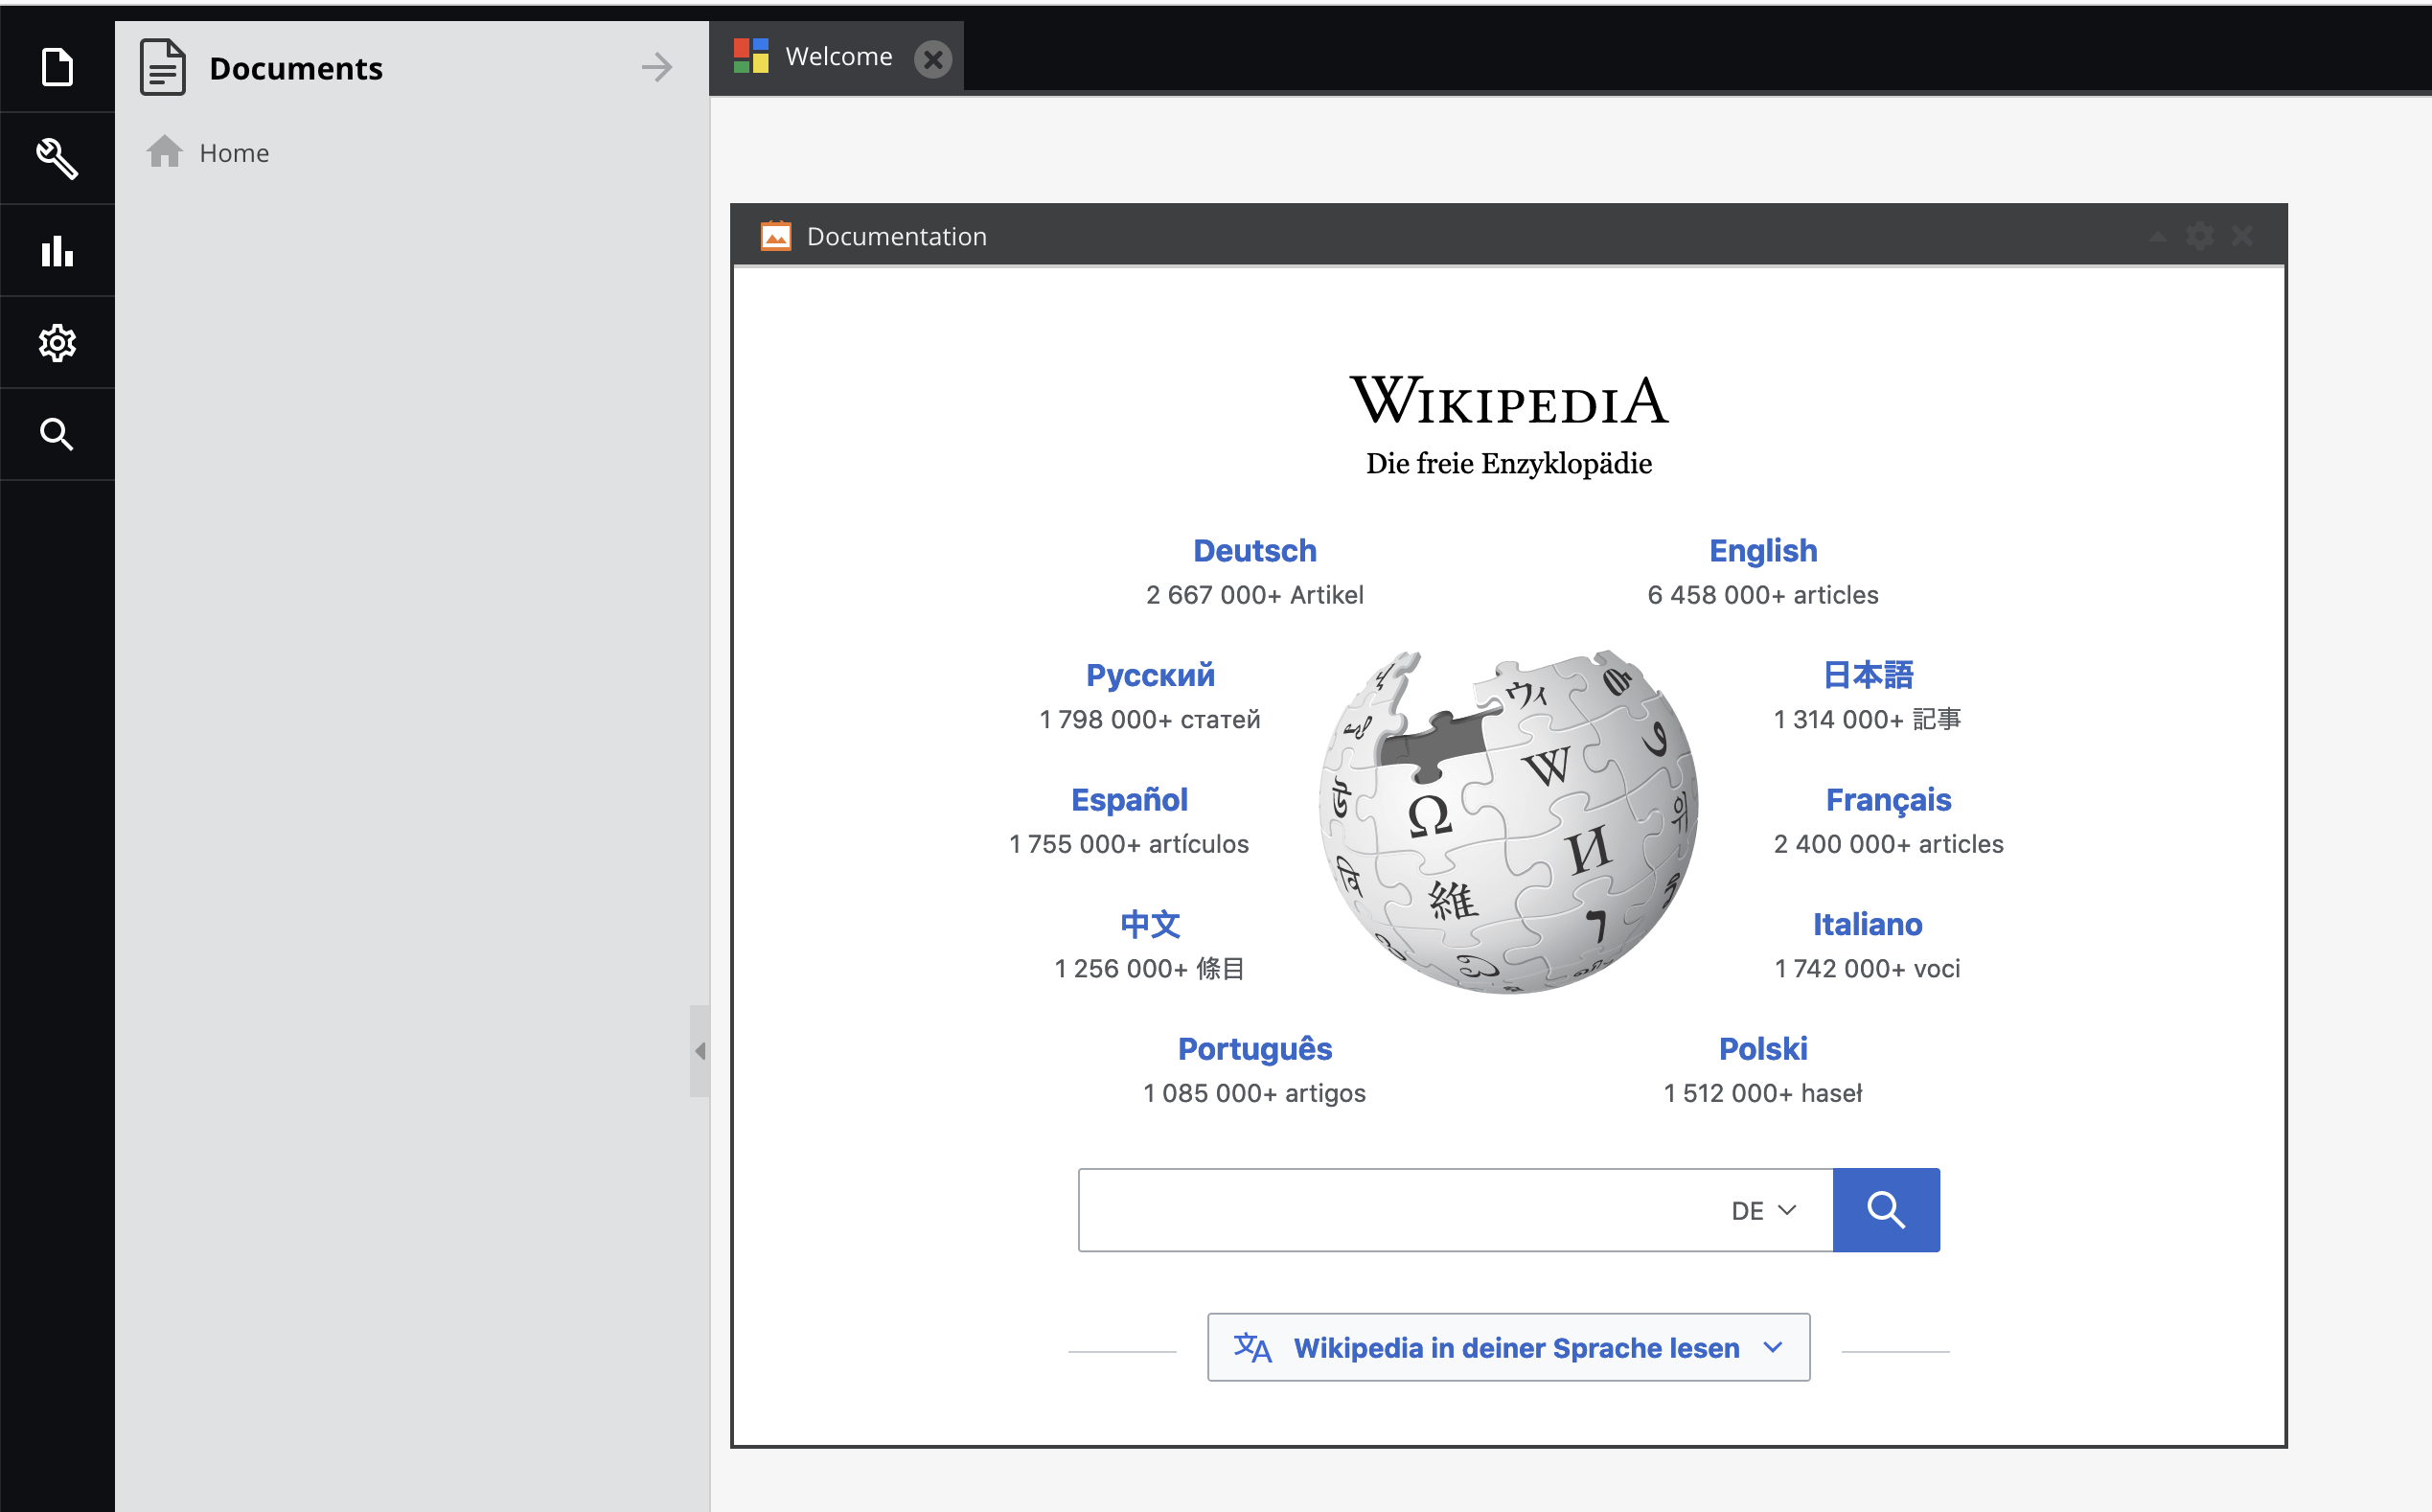
Instead of being displayed in another browser tab, the content of external websites can be displayed on the dashboard using the I-Frame bundle from Blackbit. This is always useful if the user does not know the address of the content to be displayed or needs to be reminded to take a look at external, regularly updated content.
Possible applications are
- Display of instructions and help pages
- Display of external reports
- Display of news pages
We are sure that you can think of other ways to make the work of your Pimcore users easier by displaying external information. As a Pimcore Gold Partner and active contributor, we are always interested in improving the benefits and usability of Pimcore. That is why we are making our small extension available to you free of charge.
All Pimcore versions from 5.4 are compatible with the I-Frame bundle.You can purchase the I-Frame bundle directly via the Pimcore Marketplace. If you have any questions or feedback, please contact us at
sales@blackbit.de
.
Blackbit and Pimcore
Blackbit develops digital commerce platforms based on the data and experience management platform Pimcore. Frequently recurring customer requirements are incorporated into the design and programming of our Pimcore bundles. These bundles are primarily intended for medium-sized companies that want to implement individual requirements. For companies that use Pimcore as a strategic platform and therefore want to integrate as many services and applications as possible into this platform, we are happy to advise on the use of the Pimcore Enterprise Edition, which provides the most important functions and services for larger companies for a monthly fee.
Leave us feedback